
In the world of data analytics, where insights drive decision-making, Power BI continues to lead the charge with its robust features. Among these is the Cross-Report Drillthrough, a tool that enhances user experience by providing seamless navigation between related reports while maintaining context through filters. This feature is not just convenient—it’s transformative for in-depth analysis.
Let’s explore the scientific and practical aspects of this feature and how it can redefine your reporting workflows.
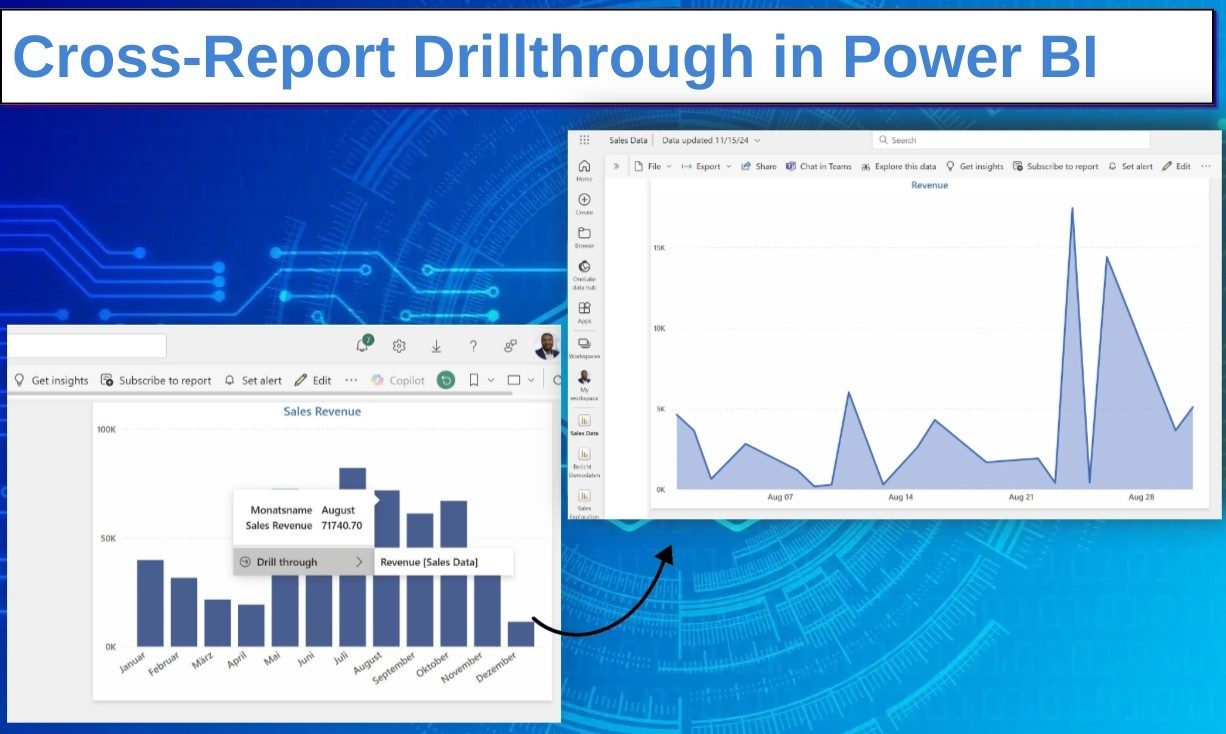
What Is Cross-Report Drillthrough?
Cross-Report Drillthrough allows users to navigate between different reports within the same workspace or app while retaining the contextual filters applied in the source report. This feature bridges the gap between separate but related reports, enabling more holistic analysis without manual adjustments.
Imagine analyzing regional sales performance in one report and seamlessly jumping into another report to assess product-level details for a specific region—all without losing focus or context. This level of interconnectedness accelerates insights and reduces the cognitive load on users.
The Science Behind Cross-Report Drillthrough: How It Works
Cross-report drillthrough relies on a blend of data model alignment and filter propagation mechanics. Here’s a deeper dive into the underlying processes:
1. Data Model Validation
At its core, the feature requires a logical relationship between the source and target reports. While the reports can have different schemas, certain key conditions must be met for the filters to pass effectively:
- Field and Table Names Must Match: Cross-report drillthrough identifies relationships through matching field names. This includes capitalization—“Region” is not the same as “region” in Power BI.
- Shared Data Fields: These are the “common denominators” that allow context transfer. For example, if both reports share a
ProductIDfield, filtering onProductIDin the source report will apply the same filter in the target report.
The alignment of schemas ensures smooth navigation and data consistency, reducing the risk of misapplied filters or errors during analysis.
2. Filter Context Propagation
Power BI uses filter propagation to carry the applied filters from the source report to the target. When a user drills through:
- The selected filters are bundled and sent as query parameters.
- These filters are dynamically applied to the visualizations in the target report.
This mechanism ensures that the transition between reports feels natural and intuitive.
3. Case Sensitivity
Power BI’s handling of field names is case-sensitive, which can lead to unintended errors if overlooked. For instance, Sales Revenue in one report and sales revenue in another will not be recognized as the same field. This attention to detail highlights Power BI’s emphasis on precision and underscores the importance of meticulous data model design.
Setting Up Cross-Report Drillthrough: A Step-by-Step Guide
Implementing cross-report drillthrough involves a series of deliberate actions to ensure smooth functionality. Here’s a step-by-step guide:
Step 1: Align the Data Models
Before enabling the feature, verify that the source and target reports share common fields and that these fields have identical names (including case). Cross-check for:
- Consistent table and field naming conventions.
- Uniform data types for the shared fields.
💡 Pro Tip: Use a centralized data model or establish strict naming conventions during the development phase to avoid inconsistencies.
Step 2: Enable Drillthrough in the Target Report
Navigate to the target report and enable the drillthrough functionality for the desired page:
- Add a Drillthrough Filter: Drag the common fields into the Drillthrough filters pane in the report editor.
- Design the page: Optimize the layout of the drillthrough page to focus on the context passed from the source.
Step 3: Test the Connection
In the source report, right-click on a data point or visualization and select the drillthrough option. Verify that:
- The correct page in the target report opens.
- The filters are applied as expected.
Troubleshooting common issues (e.g., mismatched fields or case discrepancies) at this stage will save time later.
Step 4: Publish and Share
Once validated, publish both reports in the same workspace or app. Ensure that users have appropriate permissions to access both reports.
Benefits of Cross-Report Drillthrough: Why It Matters
The cross-report drillthrough feature is not just a tool for navigation—it’s a strategic enabler for businesses. Here’s why:
- Enhanced User Experience
By connecting related reports, users can explore data intuitively without needing to reapply filters manually. This seamless navigation reduces friction and accelerates insights. - Streamlined Workflows
Teams can link high-level dashboards with detailed analysis pages, creating a multi-layered reporting structure that supports both overview and granular investigation. - Improved Decision-Making
Retaining filter contexts ensures that users are always analyzing consistent data. This minimizes errors and enhances the reliability of insights. - Efficiency Gains
Cross-report drillthrough saves time by eliminating redundant filtering processes and unnecessary navigation steps.
Use Cases for Cross-Report Drillthrough
The versatility of this feature makes it applicable across industries and domains. Here are some common scenarios:
- Retail Analysis: Connect a sales performance dashboard to a detailed customer segmentation report to explore regional sales trends by demographics.
- Supply Chain Management: Drill through from an inventory overview to a specific supplier performance report to assess bottlenecks.
- Healthcare Analytics: Link a hospital KPI dashboard with a patient satisfaction report to investigate trends in service quality.
Final Thoughts
Cross-report drillthrough in Power BI exemplifies the platform’s commitment to empowering users with advanced analytical tools. By enabling seamless navigation between related reports, it fosters a deeper understanding of data and facilitates faster, more informed decision-making. For organizations striving to enhance their analytics capabilities, mastering this feature is a step toward unlocking new possibilities.
Embrace the power of connected insights—set up cross-report drillthrough today and transform the way you analyze data!