
How I Reduced a Semantic Model from 10 GB to 17 MB Using the Memory Analyzer in Microsoft Fabric
Performance issues in analytical reports are often attributed to complex visuals, inefficient DAX measures, or large datasets. However, in many cases the real bottleneck lies deeper — in the structure and memory consumption of the semantic model itself.
In a recent project, I encountered a Power BI report with extremely poor performance. Users experienced significant delays when interacting with visuals, making the report frustrating to use in daily operations. Rather than immediately optimizing report visuals or rewriting measures, I decided to take a step back and analyze the memory structure of the semantic model behind the report.
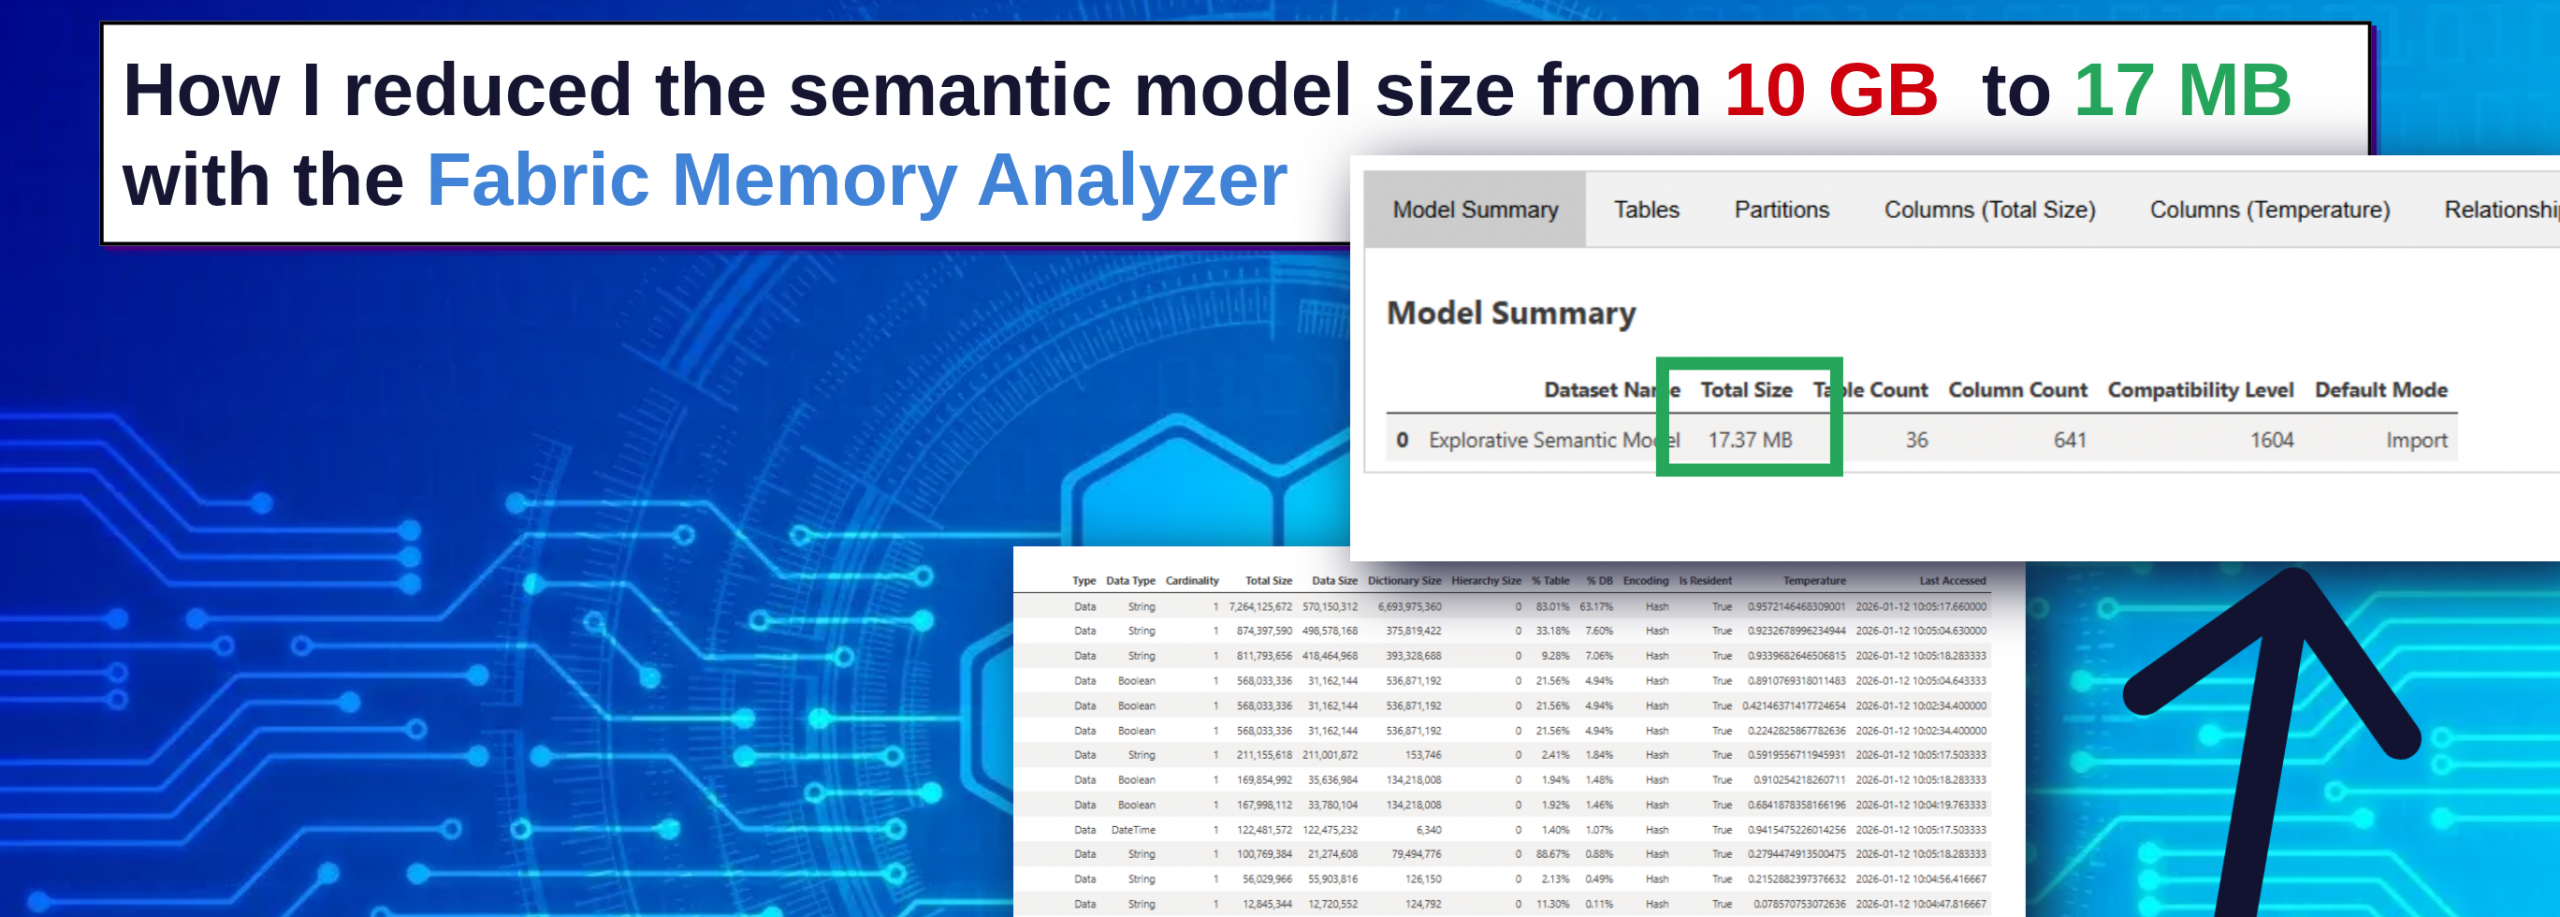
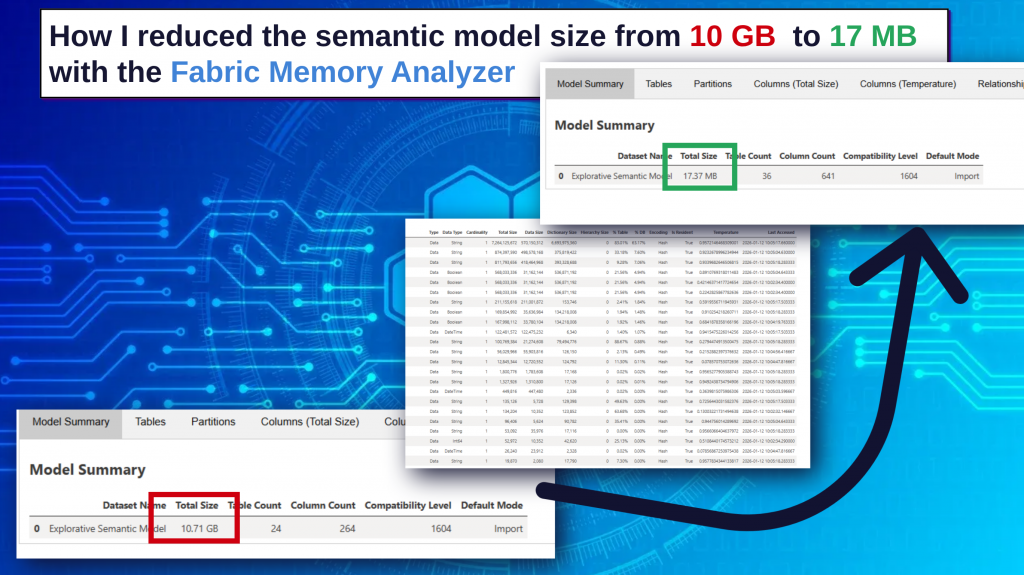
Using the Memory Analyzer available in Microsoft Fabric, I was able to identify the root cause of the issue and dramatically reduce the model size from 10.71 GB to just 17 MB.
This article explains the investigation process, the tools used, and the optimization techniques that led to this improvement.
Understanding the Problem: Slow Report Interactions
The initial problem was straightforward: users reported that the Power BI report was extremely slow when interacting with visuals.
Common symptoms included:
- Long loading times when filtering visuals
- Delays when switching between report pages
- Slow query execution when aggregating data
While such issues are sometimes caused by inefficient DAX calculations or poorly designed visuals, they are often linked to inefficient semantic model design, especially when the model contains:
- high-cardinality columns
- unnecessary columns
- inefficient relationships
- large dictionary sizes
To identify the real issue, I decided to analyze the model using a dedicated diagnostic tool.
Using the Memory Analyzer in Microsoft Fabric
Microsoft Fabric provides a Memory Analyzer notebook that can be executed to analyze the internal memory structure of a semantic model.
The notebook performs a detailed scan of the model and generates a comprehensive report showing how memory is consumed across:
- tables
- columns
- partitions
- relationships
This type of analysis is extremely valuable because memory consumption directly affects query performance in the tabular engine used by Power BI.
After running the notebook, the analyzer generates several diagnostic views that provide both high-level summaries and detailed insights.
Model Summary: The Starting Point
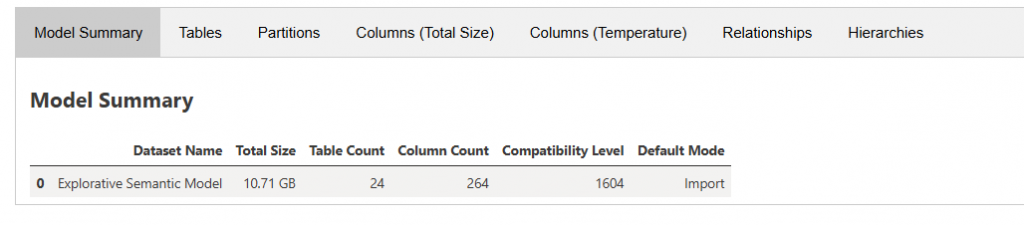
The Model Summary section provides an overview of the semantic model, including:
- total model size
- number of tables
- number of columns
- compatibility level
- storage mode
In this case, the summary immediately revealed a major issue.
The semantic model size was 10.71 GB, which is unusually large for the analytical workload the report was supporting.
This indicated that memory inefficiencies were likely present somewhere within the model structure.
However, identifying the root cause required deeper analysis.
Table-Level Analysis

The Tables tab provides a breakdown of memory consumption per table.
For each table, the analyzer shows metrics such as:
- total memory size
- dictionary size
- percentage of total database size
This view is particularly useful for identifying tables that dominate the memory footprint of the model.
Often, only a few tables are responsible for the majority of the model size. When those tables are identified, the next step is to analyze them at the column level.
Column-Level Analysis: Where the Real Insights Appear
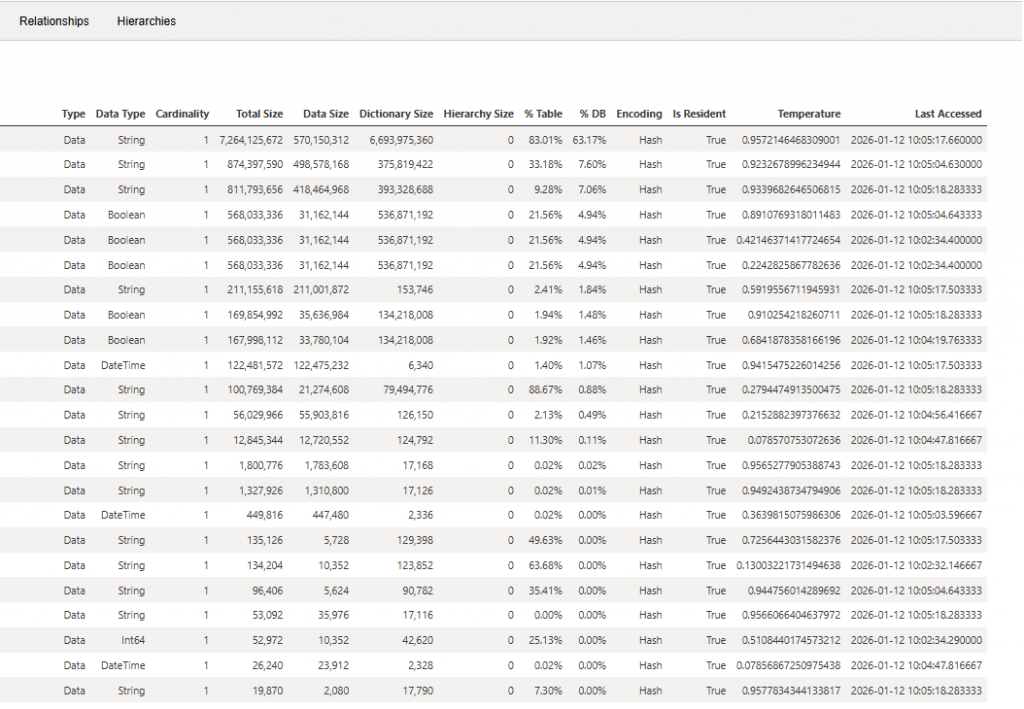
The Columns (Total Size) view is typically the most valuable section of the Memory Analyzer output.
It provides column-level statistics including:
- data type
- total memory size
- data size
- dictionary size
- percentage of database size
- column temperature
Column temperature is an especially useful metric because it indicates how frequently a column is accessed in queries.
High-temperature columns that also consume large amounts of memory often become prime candidates for optimization.
In this case, the column analysis revealed a striking pattern.
Identifying the Root Cause
The analysis showed that approximately 85% of the total model memory was consumed by only five columns across two tables.
These columns had extremely high cardinality, meaning they contained a large number of unique values. High-cardinality columns are known to significantly increase dictionary size and reduce compression efficiency in the tabular storage engine.
Further investigation revealed that these columns were heavily used in a DISTINCTCOUNT() calculation within the model.
DISTINCTCOUNT() is a powerful aggregation function, but when applied to very large columns with high cardinality, it can dramatically increase both:
- memory consumption
- query processing cost
This combination was the main reason for the oversized semantic model and the poor report performance.
Optimizing the Model
To address the issue, I focused on refactoring the DAX logic and reducing unnecessary memory usage.
The optimization process included:
- reviewing DAX measures referencing high-cardinality columns
- refactoring calculations that relied on DISTINCTCOUNT
- limiting unnecessary column usage in aggregations
- restructuring parts of the semantic model
These changes significantly reduced the amount of data that needed to be stored and processed by the model.
The Result
After implementing the optimizations, the impact was dramatic.
The semantic model size was reduced from:
10.71 GB → 17 MB

This optimization led to several improvements:
- significantly faster report interactions
- improved query performance
- faster refresh operations
- a cleaner and more efficient semantic model structure
Most importantly, users immediately noticed the difference when interacting with the report.
Key Lessons Learned
This experience highlights an important principle in analytical model design:
Report performance often depends more on the semantic model than on the report visuals themselves.
When facing performance issues in Power BI reports, it is essential to analyze the model at a deeper level.
Tools like the Memory Analyzer in Microsoft Fabric provide valuable insights into:
- model memory distribution
- high-cardinality columns
- inefficient structures
- dictionary sizes and compression efficiency
These insights make it possible to identify optimization opportunities that are otherwise extremely difficult to detect.
Conclusion
Optimizing semantic models is one of the most impactful ways to improve performance in modern analytics solutions.
By leveraging the Memory Analyzer in Microsoft Fabric, it becomes possible to understand how memory is consumed inside a model and pinpoint exactly where improvements can be made.
Sometimes, as this case demonstrates, just a few columns can account for the majority of a model’s memory footprint.
Identifying and optimizing these elements can lead to dramatic improvements in both model efficiency and report performance.