
With a Strong Focus on Consumption: Power BI & Conversational BI with Copilot
Microsoft Fabric introduces a unified analytics platform that brings together data integration, engineering, modeling, and consumption under one SaaS experience.
While Fabric is extremely powerful, it can also feel overwhelming at first — especially for teams coming from classic Power BI or traditional ETL + data warehouse setups.
This article presents a simple, pragmatic Fabric architecture designed to:
- Lower the entry barrier into Fabric
- Avoid unnecessary complexity in early stages
- Put data consumption at the center of the design
The guiding principle is straightforward:
If users cannot easily consume and interact with data, the architecture has failed — no matter how elegant the pipeline looks.
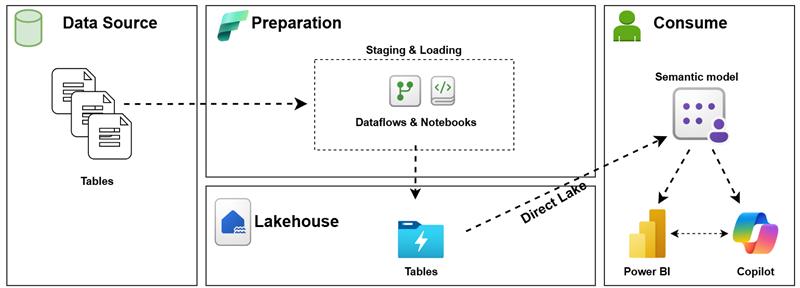
Architecture Overview
The architecture consists of four logical layers:
- Data Source
- Preparation (Staging & Loading)
- Lakehouse
- Consumption (Semantic Model, Power BI, Copilot)
Each layer has a clear responsibility, minimal overlap, and is designed to evolve independently.
1. Data Source Layer – Keep It Boring (on Purpose)
The data source layer represents operational systems such as:
- Relational databases
- APIs
- Files (CSV, Excel, JSON)
- SaaS applications
In this architecture, no transformation logic lives here.
The goal is not to optimize sources, but to extract data reliably and predictably.
Why this matters:
- Fabric works best when transformations are centralized
- Source systems remain untouched
- Governance and lineage stay clear
2. Preparation Layer – Controlled Entry into FabricThe preparation layer acts as a gentle onboarding zone into Fabric.
Tools used:
- Dataflows Gen2
- Notebooks (Spark)
Responsibilities:
- Initial ingestion
- Light transformations
- Standardization (types, naming, basic cleansing)
- Loading data into the Lakehouse
This layer is intentionally flexible:
- Dataflows are ideal for low-code ingestion and business-friendly pipelines
- Notebooks allow advanced logic when needed (joins, enrichment, Python/SQL logic)
Key principle:
Prepare data just enough to be usable — not perfect.
Heavy business logic is postponed to the semantic layer where it belongs.
3. Lakehouse – The Single Source of TruthThe Lakehouse is the central storage layer of this architecture.
What lives here:
- Delta tables
- Structured, queryable datasets
- Clean but not over-modeled data
Why Lakehouse?
- Native Fabric experience
- Supports Direct Lake
- One copy of data for multiple use cases
- Clear separation between storage and semantics
In this design, the Lakehouse is:
- Stable
- Predictable
- Consumption-ready
It is not overloaded with reporting logic, KPIs, or business rules.
4. Consumption Layer – Where Value Is Created
This is the most important layer of the architecture.
Components:
- Semantic Model
- Power BI
- Copilot (Conversational BI)
Everything upstream exists to serve this layer.
4.1 Semantic Model – The Real Business Layer
The semantic model is where raw data becomes business-understandable data.
Responsibilities:
- Relationships
- Measures (DAX)
- Business logic
- Time intelligence
- KPIs
- Security (RLS / OLS)
Using Direct Lake, the semantic model:
- Reads directly from Lakehouse tables
- Avoids data duplication
- Offers high performance with minimal latency
This is the layer where:
- Finance definitions live
- Metrics are standardized
- “One version of the truth” is enforced
4.2 Power BI – Interactive Analytics
Power BI sits on top of the semantic model and provides:
- Dashboards
- Reports
- Exploratory analysis
- Self-service analytics
Because the model is well-defined:
- Report developers move faster
- Business users trust the numbers
- Changes propagate consistently
This architecture supports:
- Thin reports
- Reusable datasets
- Scalable report development
4.3 Copilot – Conversational BI on Top of Semantics
Copilot represents a new consumption paradigm.
Instead of navigating visuals, users can:
- Ask questions in natural language
- Explore KPIs conversationally
- Get explanations based on the semantic model
Why this only works with a clean semantic model:
- Copilot relies on measures, relationships, and metadata
- Poor modeling leads to poor answers
- Clear naming and definitions become critical
In this architecture:
Copilot does not replace Power BI — it complements it.
Power BI remains the primary analytical interface, while Copilot lowers the barrier for:
- Executives
- Occasional users
- Exploratory questions
Why This Architecture Works Well for Fabric Adoption
1. Low Cognitive Load
- Few moving parts
- Clear responsibilities
- Easy to explain to stakeholders
2. Consumption-First Design
- Architecture decisions are driven by how data is consumed
- Semantic model is treated as a first-class citizen
3. Scalable Without Redesign
- Can start small
- Easily extendable with:
- More Lakehouses
- Warehouses
- Advanced governance
- CI/CD
4. Future-Proof for AI
- Copilot-ready
- Metadata-driven
- Semantic-first approach
Final Thoughts
Microsoft Fabric enables extremely sophisticated architectures — but not every team needs complexity on day one.
This simple architecture:
- Gets data flowing
- Delivers value quickly
- Prioritizes user interaction
- Builds a solid foundation for Power BI and Copilot
If users can:
- Trust the numbers
- Understand the model
- Ask questions naturally
…then the architecture is doing its job.