
Data analytics is not just about numbers and charts. It’s about telling a story — a story that inspires action, drives decisions, and makes complex data accessible and engaging. In this digital age, storytelling is a vital skill for any data professional.
Imagine presenting a complex dataset to a non-technical audience. Without context and narrative, the numbers can feel overwhelming and disconnected. This is where the art of storytelling, combined with powerful tools like Power BI, makes all the difference.
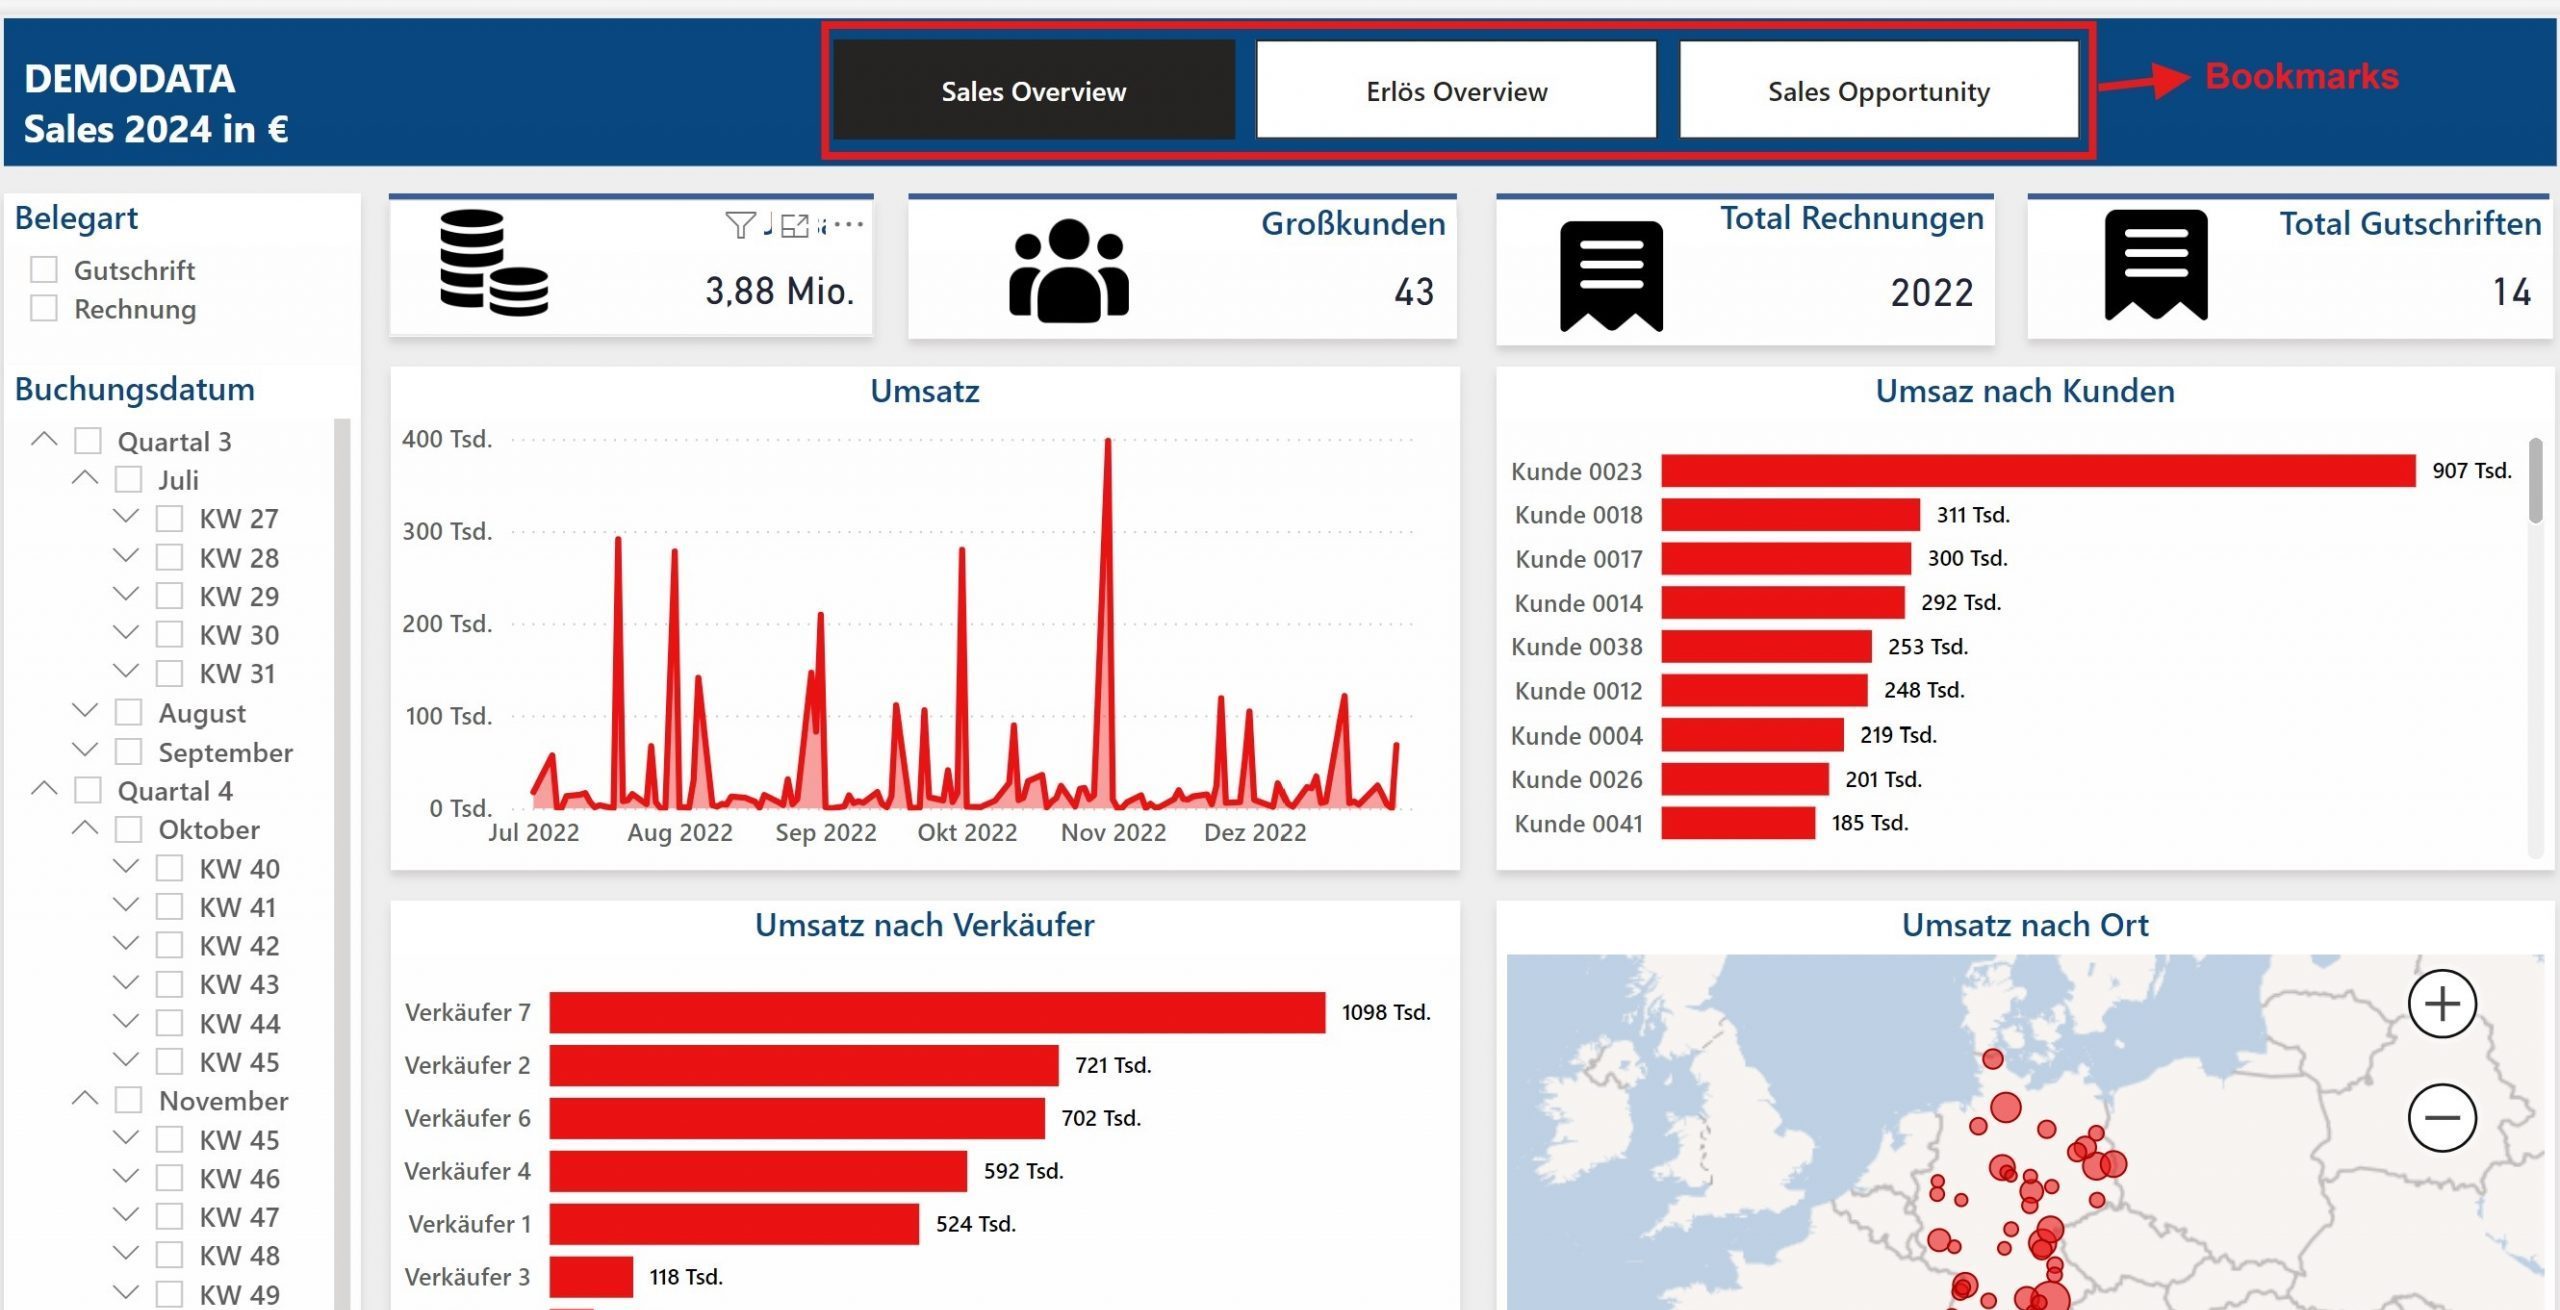
One feature that stands out in Power BI for storytelling is the Bookmark functionality. Think of bookmarks as snapshots of your report that capture specific views, filters, or selections. They allow you to guide your audience through a seamless, interactive journey. Instead of jumping between static slides, bookmarks help you craft a dynamic narrative that adapts to your audience’s needs.
Step-by-Step Guide to Using Bookmarks for Storytelling in Power BI
Want to enhance your Power BI report with bookmarks? Follow these simple steps to create an engaging, interactive experience:
1️⃣ Prepare Your Report Views:
- Identify key insights or sections of your report that you want to highlight.
- Adjust the filters, slicers, and visuals to display the desired view.
Example from the provided report:
- Bookmark 1: High-level sales overview (total sales, total devices, and total receipts).
- Bookmark 2: Sales performance by product family (focus on product categories).
- Bookmark 3: Sales trends over time (visualize monthly or quarterly performance).
- Bookmark 4: Customer-specific insights (branch-level data and key customer contributions).
2️⃣ Create a Bookmark:
- Go to the View tab in Power BI Desktop.
- Click on Bookmarks Pane to open it.
- Once your report is set to the desired view, click Add in the Bookmarks Pane. Give your bookmark a meaningful name.
Example from the provided report:
- Add a bookmark for each of the views described above, such as „Overview,“ „Product Families,“ „Trends,“ and „Customer Insights.“
3️⃣ Organize Your Bookmarks:
- Repeat the process for each key insight you want to showcase.
- You can reorder and group bookmarks for a smoother flow.
Example:
- Group bookmarks under categories like „Sales Overview,“ „Detailed Analysis,“ and „Customer Insights.“
4️⃣ Link Bookmarks to Buttons:
- Go to the Insert tab and add a Button or Shape to your report.
- In the Format pane, select Action, toggle it to On, and choose Bookmark from the dropdown.
- Link the button to the respective bookmark for easy navigation.
Example from the provided report:
- Create buttons for navigating between bookmarks, such as „Go to Overview,“ „Explore Product Families,“ „View Trends,“ and „Customer Details.“
5️⃣ Test the Navigation:
- Run through your report and ensure that the bookmarks lead to the intended views.
- Make adjustments if necessary to enhance the storytelling flow.
Example Use Case: Sales Performance Report
Using bookmarks in the provided report: 📌 Start with a high-level sales overview: Show total revenue, devices sold, and customer receipts. 📌 Highlight key product families and their performance: Use the pie chart to visualize the revenue distribution across product families. 📌 Dive into customer-specific data: Use the bar chart to show revenue contributions from key customers in various branches. 📌 Compare sales trends over time: Use the line chart to display monthly sales trends and identify peaks. 📌 End with a call to action based on your findings: Summarize key insights and suggest next steps.
This interactivity transforms traditional reporting into a captivating experience. It makes your audience feel part of the story, enabling them to explore insights at their own pace.