
As data professionals, we are always on the lookout for tools that can make our workflow more efficient and intuitive. Recently, I had the opportunity to test the newly released R package GWalkR, and I found it to be a game-changer in the realm of Exploratory Data Analysis (EDA).
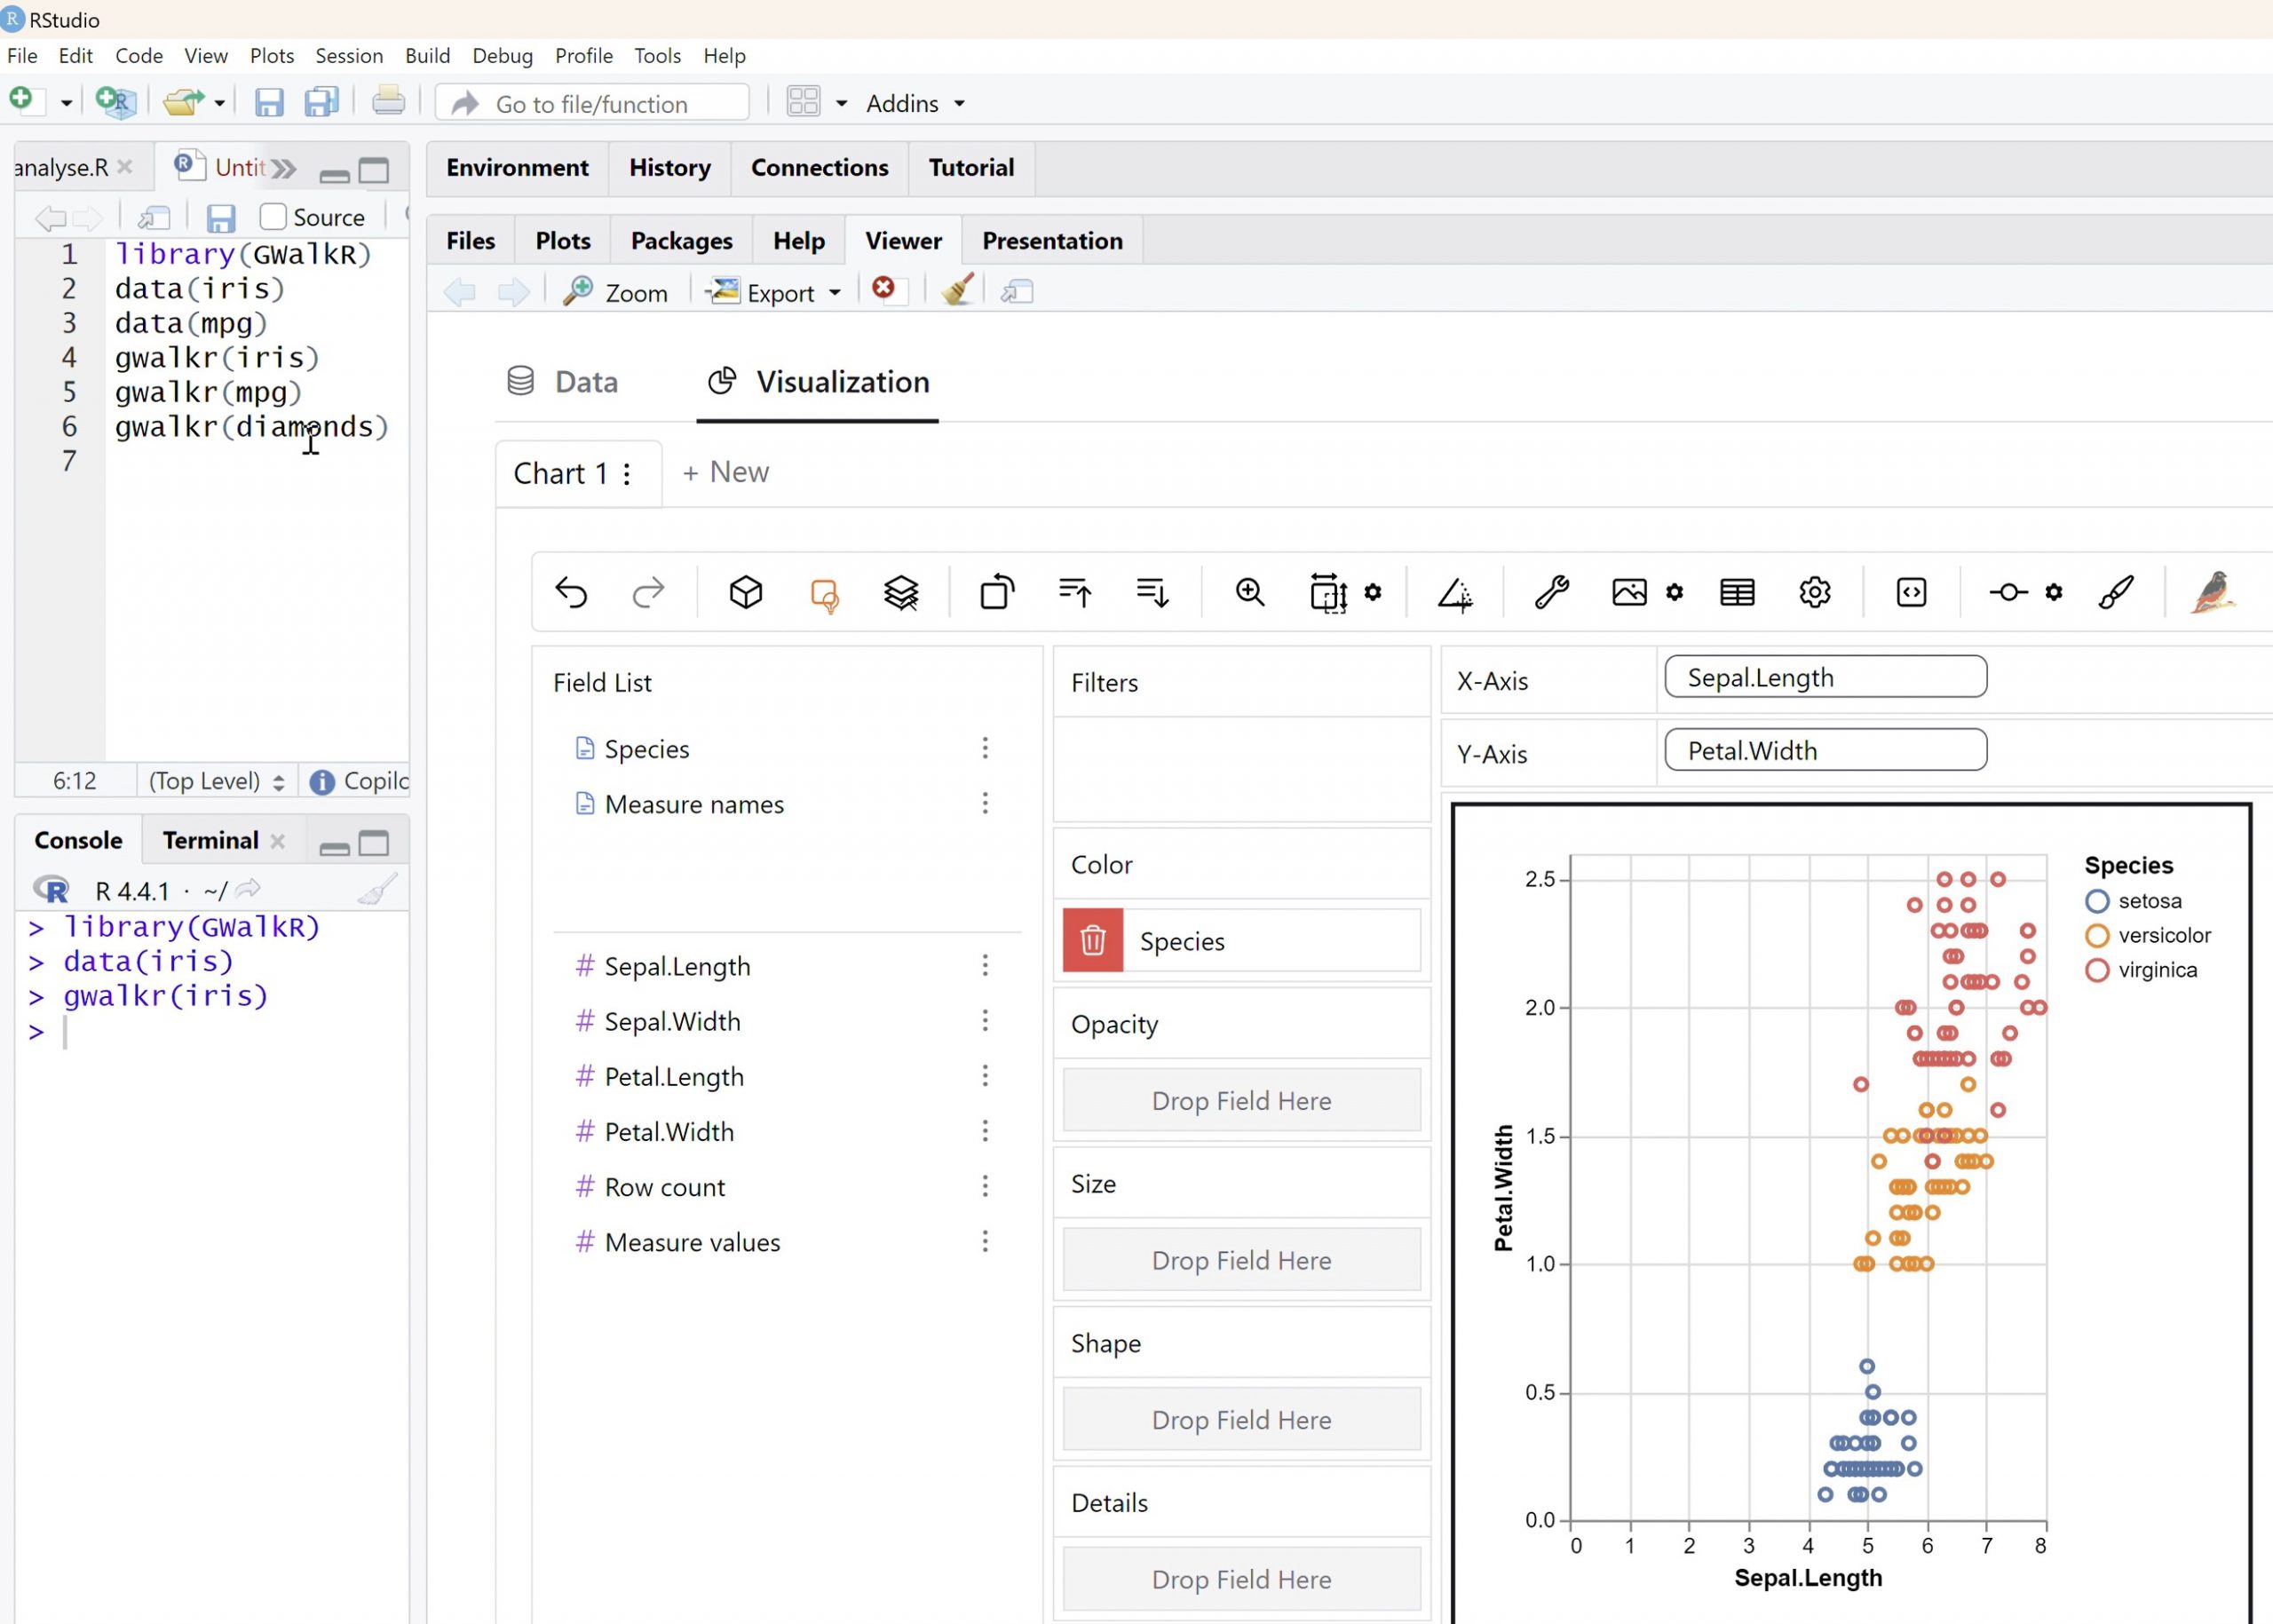
GWalkR is designed to simplify data analysis by transforming an R dataframe into an interactive, Tableau-style user interface with just a single line of code. This seamless integration allows users to dive deep into their data without getting bogged down by complex coding or intricate setup procedures. Whether you’re a seasoned data analyst or just starting your journey in data science, this tool offers something valuable for everyone.
Key Features of GWalkR
- Interactive Data Exploration: One of the standout features of GWalkR is its ability to convert your data into an interactive environment. This allows you to explore your data dynamically, which is particularly useful for identifying patterns, spotting outliers, and understanding distributions. The interface is reminiscent of Tableau, which many in the data community are familiar with, making it easy to adopt and use.
- Ease of Use: The package is incredibly user-friendly. With just a single line of R code, you can open up a world of possibilities. This simplicity is a significant advantage for those who may not have advanced programming skills but still want to perform comprehensive data analysis. It reduces the learning curve and makes sophisticated data exploration accessible to a broader audience.
- Streamlined Workflow: GWalkR effectively bridges the gap between data analysis and visualization, combining these two essential components of EDA into a cohesive workflow. By allowing analysts to both explore and visualize their data in one environment, it minimizes the need for switching between different tools, thus saving time and reducing the potential for errors.
- Flexibility and Customization: While GWalkR simplifies many aspects of data exploration, it also provides flexibility for customization. Advanced users can tailor their experience, adjusting the visualization settings and data parameters to suit their specific needs. This makes it a versatile tool that can adapt to various data types and exploration goals.
Why GWalkR is Worth Trying
If you are someone who regularly engages in data exploration in R, GWalkR offers a refreshing and powerful approach. Its ease of use and interactive capabilities make it a valuable addition to your data science toolkit. Here are a few reasons why you should consider giving it a try:
- Speed and Efficiency: Quickly generate insights without needing to write extensive code. This is particularly beneficial during the early stages of analysis when you want to get a quick sense of your data.
- Enhanced Data Understanding: The interactive UI facilitates a deeper understanding of the data, helping to uncover insights that might be missed with static graphs and traditional methods.
- Integration with R: As an R package, GWalkR fits seamlessly into existing workflows for those who are already using R for data analysis. This ensures a smooth integration without the need for additional software.
Conclusion
In a world where data is increasingly complex, tools like GWalkR simplify the process of understanding and visualizing data. Whether you’re performing preliminary data analysis or diving deep into complex datasets, GWalkR offers a user-friendly and efficient solution. I highly recommend giving GWalkR a try if you’re looking to enhance your EDA process in R. Not only will it streamline your workflow, but it will also provide you with deeper insights into your data, making your analysis more effective and impactful.
Explore the potential of GWalkR today and see how it can transform your approach to data exploration and visualization in R.