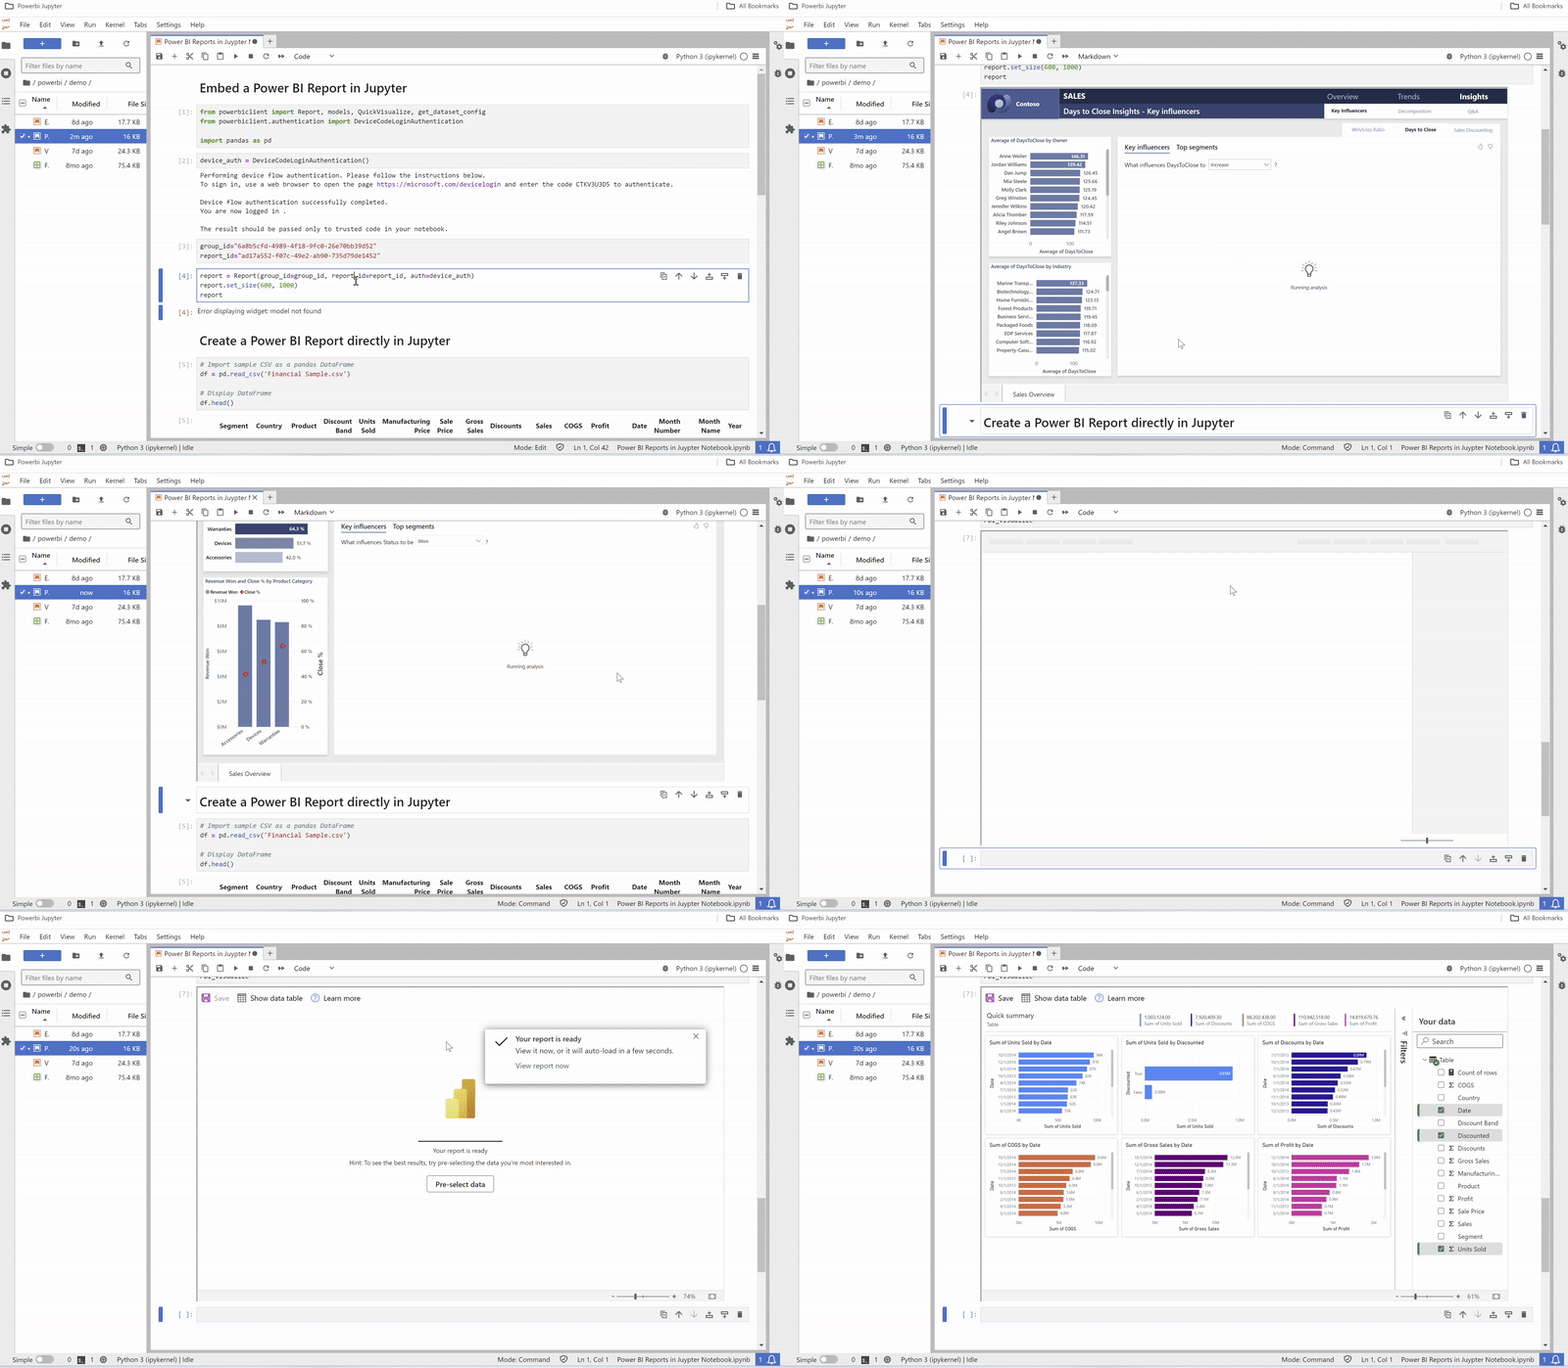
In recent experiments, I have explored the exciting potential of integrating Power BI directly within a Jupyter notebook using the powerbiclient Python package. This innovative approach allows for seamless embedding and creation of Power BI reports, dashboards, and report visuals right within the notebook environment, thus maintaining an uninterrupted workflow.
Embed a Power BI Report in Jupyter
The process is simple. Start by installing powerbiclient using pip, and then import into your notebook the relevant models from the package, and pandas for dataframe. The powerbiclient package is a powerful tool that facilitates not just the visualization of data but also its storytelling. By leveraging this package, data scientists and analysts can generate reports that are both interactive and visually appealing, enhancing the interpretability of complex data sets. This feature is particularly valuable for making data-driven decisions and presenting findings in a more engaging manner.
from powerbiclient import Report, models, QuickVisualize, get_dataset_config
from powerbiclient.authentication import DeviceCodeLoginAuthentication
import pandas as pd
Then embed the Power BI report afther indicating the location workspace id and the id of the report.
group_id="6a8b5cfd-4989-4f18-9fc0-26e70bb39d52"
report_id="ad17a552-f07c-49e2-ab90-735d79de1452"
report = Report(group_id=group_id, report_id=report_id, auth=device_auth)
report.set_size(600, 1000)
report
Create a Power BI Report directly in Jupyter
A further possibility is to create a pandas DataFrame from your data, perform any necessary preprocessing, and authenticate to Power BI using our provided authentication class. With your DataFrame and authentication in place, you can now create a Power BI report instance, which will auto-generate a Power BI report from your data within seconds.
# Create a Power BI report from your data
PBI_visualize = QuickVisualize(get_dataset_config(df), auth=device_auth)
# Render new report
PBI_visualize.set_size(600, 1000)
PBI_visualize
The generated report will include interactive and visually appealing visualizations, allowing to easily tell the story of the data in a compelling way. You can customize the report further by editing the visuals and saving them as needed, or selecting different fields to take part in the data visualizations.

One of the key advantages of using Power BI within a Jupyter notebook is the ability to customize the generated reports further. Users can edit the visuals to better suit their needs, adding a layer of flexibility that traditional static reports lack. This means that each visualization can be tailored to highlight the most relevant aspects of the data, ensuring that the narrative is clear and impactful.
Moreover, the powerbiclient package is open-source, with comprehensive documentation available on GitHub. This accessibility not only encourages collaboration and innovation within the community but also ensures that users can contribute to and benefit from ongoing improvements and updates. The ease of integrating Power BI into Jupyter notebooks opens up new possibilities for data analysis and presentation, making it a valuable addition to any data professional’s toolkit.
In conclusion, integrating Power BI with Jupyter notebooks using the powerbiclient package represents a significant step forward in data visualization and analysis. It allows for a more interactive, customizable, and comprehensive approach to data storytelling, ultimately making the insights derived from data more accessible and impactful.

